Textbooks provide plots with dots showing:
-
no association
-
moderate association
-
strong association
for both positive and negative associations.
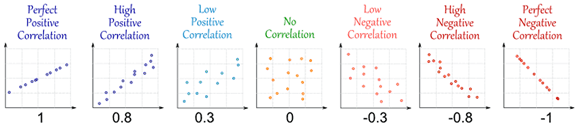
They will look similar to the diagrams below.
Association is measured with the correlation coefficient, where no association relates to a correlation of 0, a very strong positive association has a correlation near +1 and a very strong negative association has a correlation near –1.
Examples of scatter plots and an activity can be be found in Is There an Association? and Judging Associations.