Top Drawer Teachers

Examples of box plots

This activity illustrates the power of box plots to compare data sets.

Box plots can be displayed either vertically or horizontally.

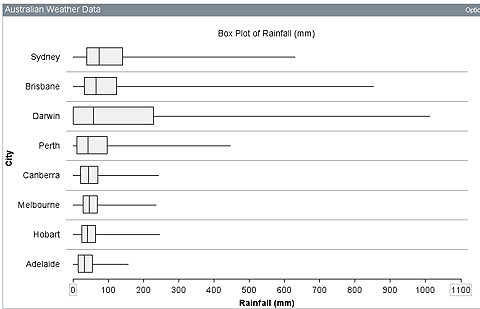
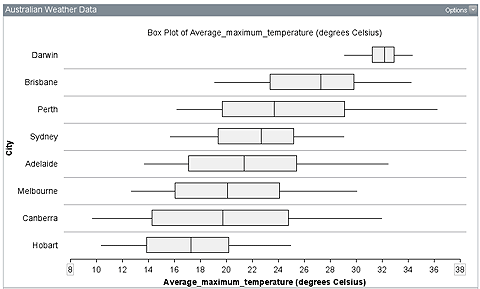
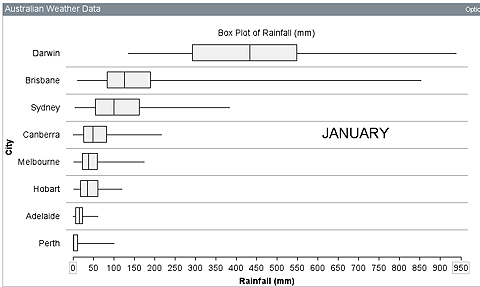
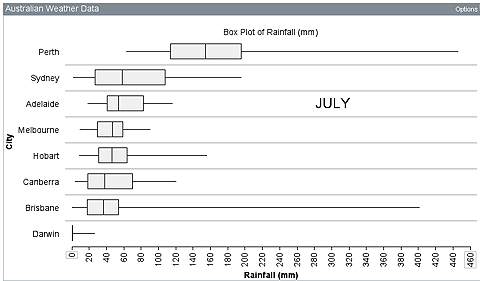
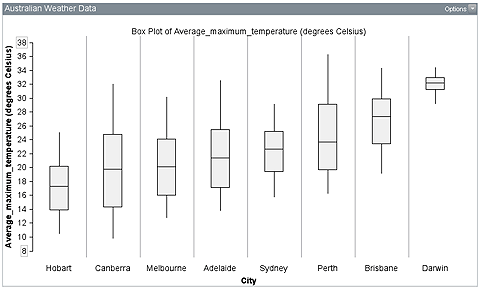
Consider the total monthly rainfall and average monthly maximum temperature of Australia's eight capital cities over 56 years.

Discuss the ordering of the cities in the various plots.

Box plots showing rainfall for Australian capital cities, ordered top down from largest to smallest medians. Order is Sydney, Brisbane, Darwin, Perth, Canberra, Melbourne, Hobart and Adelaide.
Box plots showing temperatures for Australian capital cities over 56 years, ordered top down from largest to smallest medians. Order is Darwin, Brisbane, Perth, Sydney, Adelaide, Melbourne, Canberra and Hobart.
Box plots showing rainfall for Australian capital cities, ordered top down from largest to smallest medians. Order is Darwin, Brisbane, Sydney, Canberra, Melbourne, Hobart, Adelaide and Perth.
Box plots showing rainfall for Australian capital cities, ordered top down from largest to smallest medians. Order is Perth, Sydney, Adelaide, Melbourne, Hobart, Canberra, Brisbane and Darwin.
The second plot transformed vertically and ordered from smallest to largest medians beginning at the left.

Discussion points for these plots can be found inĀ Informal Inference with Box Plots: Teacher Notes. You can also look at Features of Box Plots and Interpreting Box Plots.