Top Drawer Teachers

Interpreting box plots

TheĀ first three box plots show the heights of 136 people at ages 2, 9 and 18 years.

Three box plots showing heights drawn to the same scale. Two year olds plot has whisker range from about 80 to 95 cm. Nine year olds plot has whisker range from about 122 to 152 cm. Eighteen year olds plot has whisker range from about 154 to 196 cm.

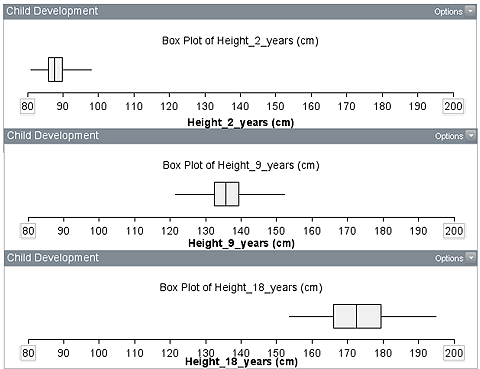
What differences do you observe?

The next three pairs of box plots show the heights of the 136 people separated by gender at each age level.

Two box plots. Female plot has whisker range from about 81 to 97 cm. Male plot has whisker range from about 81 to 98 cm.
Two box plots. Female plot has whisker range from about 122 to 153 cm. Male plot has whisker range from about 122 to 147 cm.
Two box plots. Female plot has whisker range from about 154 to 183 cm. Male plot has whisker range from about 161 to 195 cm.

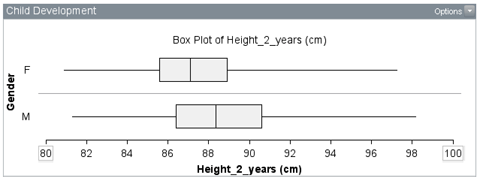
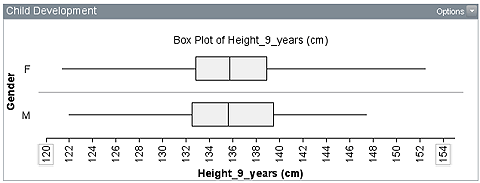
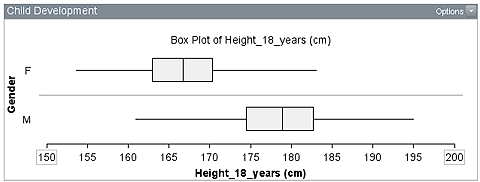
What differences do you observe now?

How confident are you in the differences between the populations represented?

There are other activities available in difficulties with informal inference.