The main distributions encountered at school are empirical distributions (created from data students collect) and theoretical distributions.
An example would be rolling a die many times and then comparing the results to a theoretical uniform distribution.
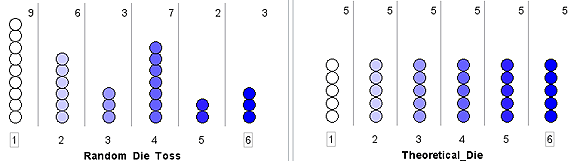
The figure below shows a comparison of 30 random tosses of a die and the theoretical uniform distribution of 5 of each outcome.
Different graphical representations show different aspects of distribution. By being exposed to many graph types during the middle years, students are led to ask the question: "How are my data distributed?"
Students can be led to consider skewness, symmetry, overall spread, outliers, means, medians, clumps and gaps.