Top Drawer Teachers

Differences in heights

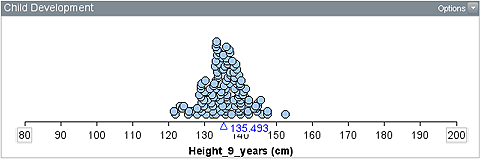
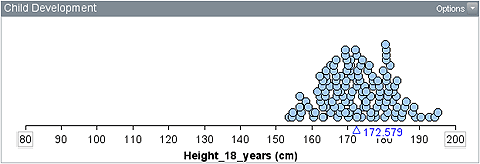
The first three plots show the heights of 136 children at ages 2, 9 and 18 years.

Dot plot with all data between 80 cm and 100 cm, with a peak at about 88 cm.
Dot plot with all data between about 120 cm and 152 cm, with a peak at about 135 cm.
Dot plot with all data between about 153 cm and 196 cm, with a peak at about 172 cm.

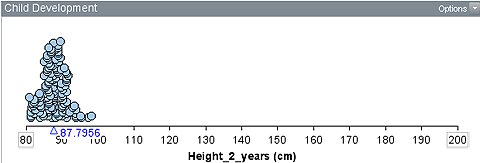
The next three plots show the heights of the 136 children separated by gender at each age level.

Two dot plots, both plots with all data between 80 cm and 100 cm, peaks at about 88 cm.
Two dot plots, both plots with all data between about 120 cm and 152 cm, peaks at about 135 cm.
Two dot plots, female plot with data between about 152 cm and 184 cm and peak at about 167 cm, male plot with data between about 160 cm and 196 cm and peak at about 179 cm.

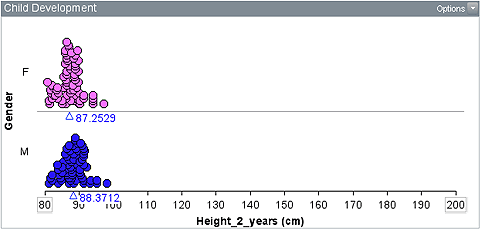
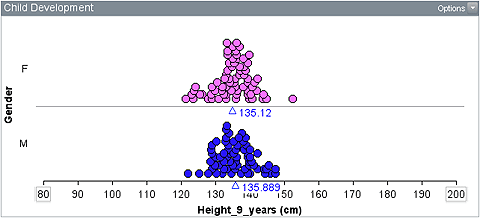
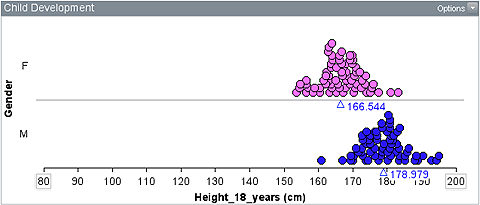
Write a description of the differences observed for the first three plots and for the second three pairs of plots. Include a statement about your confidence in the differences between the populations they represent.

Examples related to rainfall can be found in Is There a Difference? and some teaching advice on meaningful differences and difficulties with informal inference is also provided.